Measure
Online instruments characterise incoming water quality.

Discover the Compass series: predictive coagulation control for drinking water and wastewater.
The intelligence behind Compass
Compass brings online measurements and a site-specific algorithm together to calculate coagulant demand.
Online instruments characterise incoming water quality.
A site-specific algorithm translates the measurements into coagulant demand.
A calculated dose output supports the agreed plant control arrangement.
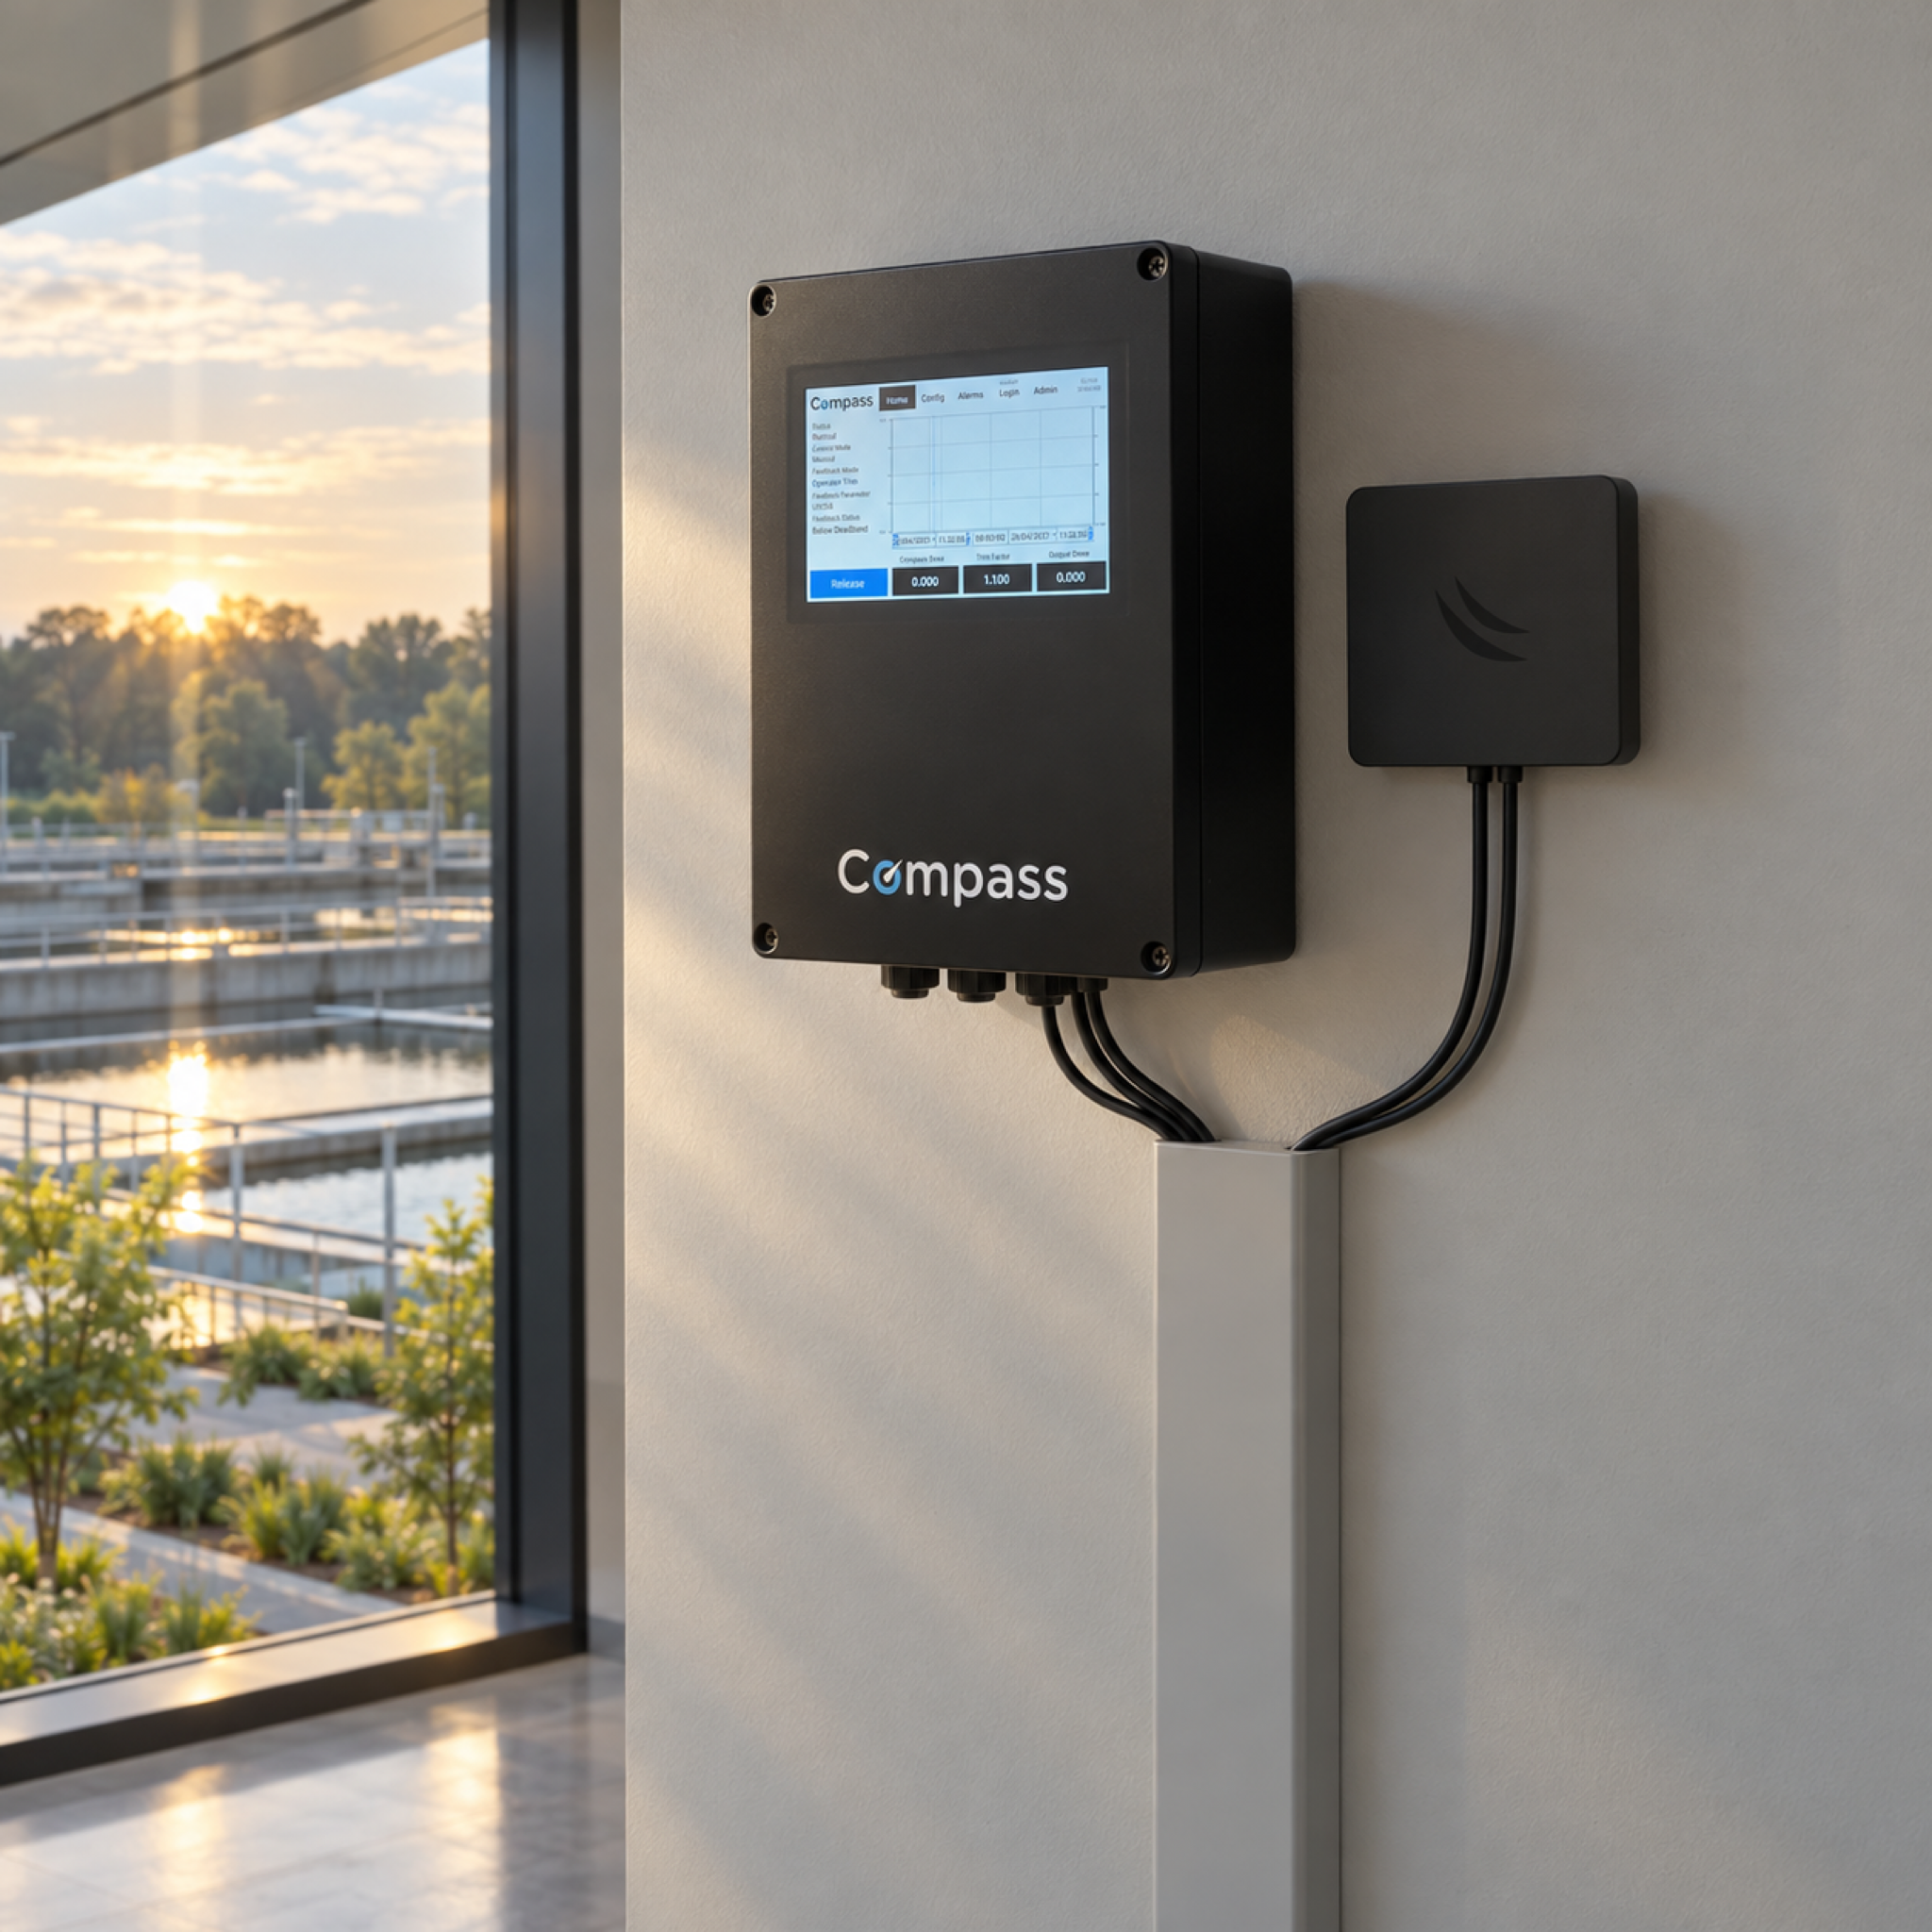
The Compass system
See the Compass control enclosure, then explore how PMA connects water measurements, a site-specific model and the treatment objective.
Software shaped around your process
The value is in the relationship between the measurements, the model and your treatment objective.
Explore the technologyBring together the online water-quality and process measurements agreed for the treatment duty. PMA reviews their location, units and history for the site.
A relationship developed from process evidence translates changes in incoming water into a predicted coagulant demand. The treatment objective shapes the model.
The calculated dose feeds the agreed plant control arrangement. Control limits, the existing dosing approach and operator responsibilities are reviewed before handover.

Follow the incoming water as conditions change, then see what the model is responding to.
Compass data / illustrative interface
Read incoming turbidity and dissolved organic carbon (DOC) alongside the calculated dose. In this example, the dose responds to rising organics even while turbidity falls.
Illustrative UI only. Fictional values; trends use separate relative scales. DOC is shown as an optical equivalent (DOCeq). Site-specific calibration and validation are required.
A published PMA case study · Mythe WTW
At Mythe, a site-specific Compass model was compared with the works’ existing dosing strategy. The published trial reported these site figures and modelled savings opportunities.
The scale of Mythe WTW in the published trial.
A year of model development and comparison with site data.
Predicted coagulant saving over six months with the stated pH-control setup.
Average predicted coagulant saving over six months.
The financial figures are predictions from the historic Mythe assessment, not measured savings or a forecast for another site. Read the case study for its conditions and source.
Four ways to respond to changing conditions. Compass and Compass EOR address drinking-water duties; Compass CPR and Compass CEP are developed for different wastewater objectives. Each approach connects online measurements with a site-specific dosing decision.

PMA · Application knowledge and support
Bring the data, the treatment objective and the detail behind your process. We’ll help you consider the next step.
Meet PMA
Useful control begins with a clear view of the water, the treatment objective and the measurements available at your works. PMA brings those details together before discussing a Compass approach.
Explore applicationsCompass insights · · Local draft
How incoming-water measurements become a more informed starting point for drinking-water coagulation control.
Read the article
Compass insights · · Local draft
A practical way to distinguish chemical phosphorus removal from chemically enhanced pre-treatment.
Read the articleTechnical information
Explore the range brochure, or ask PMA for current product information for your model and application.
A clearer starting point
Feed-forward control uses measurements of incoming water quality to calculate a dose before changes pass through treatment. A site-specific algorithm relates those measurements to coagulant demand.
Compass and Compass EOR cover drinking-water duties. Compass CPR and Compass CEP cover distinct wastewater duties. PMA can review your treatment objective, existing process and available measurements.
The instrumentation and integration depend on the system generation and the site. A configuration review establishes the sensors, control signals, communications and installation arrangement for your project.
Share the instruments, signals and control arrangement already available at your site. Compatibility and the measurements required for your application need to be reviewed for the proposed configuration.